Sorry, the Perl scripts have been removed. I made this desision because the Perl scripts were with in 10% of the size of the binary versions. I will only be releasing Binary versions now, although the Perl versions will be kept up to date for the server versions. With the change to binaries the config file has become an ini file. All binaries are self installing and on first run will install the necessary files to the same directory it is run in. N.B The ini files are backwards compatible to all versions of binary files. Although additional switches are in use. Earthquakes
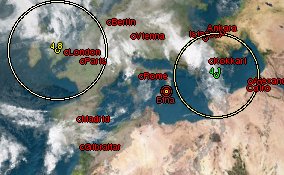 The default options are setup as follows: QuakeDetailColorMin=Green This is a quick way to tell how damaging the quake is, the text changes between the colours depending on the magnitude of the earthquake. Other options are any colour listed in RGB.txt QuakeDetailColorInt=Yellow See QuakeDetailColorMin. Other options are any colour listed in RGB.txt QuakeDetailColorMax=Red See QuakeDetailColorMin. Other options are any colour listed in RGB.txt QuakeDetailAlign=Above Where the text is written in relation to the position of the earthquake. Above,Below,Left,Right,Center QuakeCircleColor=Multi Any Colour listed in RGB.txt or Multi which changes the colour on the magnitude QuakePixelMax= See QuakePixelMin. Any number QuakePixelMin= Any number as long as it is smaller than Max number. This is really here so that fixed circles can be produced if you want to do that. Just put the same value in for both min and max QuakePixelFactor=1 This is a magnitification factor so it will accept any number ie 0.9 will desrease the size of the circle 1.1 will increase it. 1 doesn't change it. QuakeImageList= An image file that is supported. QuakeImageTransparent= Any colour in {X,Y,Z} notiation QuakeDetailList=<mag>You can use anything here. Keywords are:<time>,<date>,<mag>,<location>,<quality>,<lat>,<long> and <depth> eg. Quake happened @ <time> <location> and was a magnitude <mag>. QuakeDetailColor=Multi Sets the Text colour, Accepts anycolour listed in RGB or Multi, where it uses the top three items. Please Note I have now combined my scripts into TotalMarker that writes all my scripts and some extras.
Volcanos
The default options are setup as follows: VolcanoCircleSizeInner=4 This is the size of the inner circle for a volcano size is in pixels VolcanoCircleSizeMiddle=8 This is the size in pixels of the middle circle VolcanoCircleSizeOuter=12 This is the pixel size of the largest circle VolcanoCircleColorInner=Yellow This is the colour of the inner circle, it will accept any color in RGB.txt VolcanoCircleColorMiddle=Red This is the colour if the middle circle, it will accept any color in RGB.txt VolcanoCircleColorOuter=Brown This is the colour of the outer circle, it will accept any color in RGB.txt VolcanoNameOnOff=On By default the name of the volcano will be listed, the other value is Off VolcanoNameColor=Brown The colour of the text the name is written in VolcanoNameAlign=Below Where the name is wrtten in relation to the volcano. It will accept Above,Below,Right, Left and Center VolcanoImageList= If you want to use an image list it here VolcanoImageTransparent= Any colour in {X,Y,Z} notiation VolcanoDetailList= Any text you want to appear, Key words are <lat>,<long>,<name>,<elev>, so you could say <name> has started eurpting at <elev>m. VolcanoDetailAlign=Where the detail is written in relation to the volcano. It will accept Above,Below,Right, Left and Center VolcanoDetailColor= The text colour for the detail, it will accept nay colour listed in RGB.txt Please Note I have now combined my scripts into TotalMarker that writes all my scripts and some extras.
Storms
The Storm marker file plots the position of storms and lists name and type. ie STO,TYP,HUR,DEP for Storm, Typoon, Hurricane and Depression respectively. Thanks to Hans Ecke for the idea of tracking the storm using greatarc files. 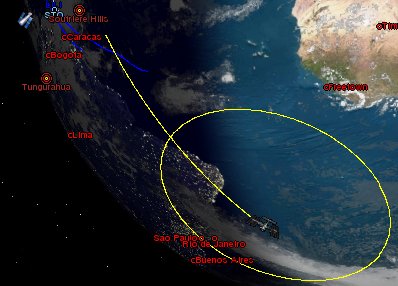 The Storm is the thing in the top left, The defaults for th text colour have changed to light blue for all text, as its easiler to read.
The default options are setup as follows: StormColorTrackReal=Blue The colour of the track that the storm has been along, it accepts any colour listed in RGB.txt StormColorTrackPrediction=SkyBlue The colour of the track its excepted along, it accepts any colour listed in RGB.txt StormNameOnOff=On The name of the storm, the other value is Off StormColorName=SkyBlue The colour of the text that the name is written in, it accepts the colours listed in RGB.txt StormAlignName=Above The postion of the text in relation to the storm position, it accepts Above,Below,Left,Right,Center StormDetailList=<type> The text you want to appear by the storm. keywords are <type>,<lat>,<long>,<name>,<speed>. eg Storm <name> is <type>. StormColorDetail=SkyBlue The text colour of the detail. it will accept the the colours listed in RGB.txt StormAlignDetail=Below The position of the detail in relation to the storm position StormImageList= If you want to use an image put it here StormImageTransparent= Any colour in {X,Y,Z} notiation StormTrackOnOff=On The track part of the storm other value is Off Please Note I have now combined my scripts into TotalMarker that writes all my scripts and some extras.
Satellites
These marker files put the Internation Space Station, Hubble Space Telescope, and the Space Shuttle if it is in orbit in to Xplanet. In Addition if the shuttles mission is not involing the ISS (and most are) it will also put in orbit the satellite it is going to meet, or if it is launching a satellite it will put that on when it is launched. The yellow trail is the last 10 minutes of flight and is only shown for the Internation Sapce Station. The Yellow Circle around the Space Station is the horizon line, i.e. if you are within the circle in theory you should be able to see the station. The line is 0 degrees. The default options are setup as follows: NoradIssImage=iss.png This uses the image surplied with xplanet NoradIssText= If you want a label with the orbit put it here NoradIssDetail=transparent={0,0,0} trail={orbit,-5,0,5} color=yellow altcirc=0 trail={orbit,-10,0,5} This is any of the options like trails put them here NoradHstImage=hst.png This needs an image downloaded for it. NoradHstText= If you want a label with the orbit put it here NoradHstDetail=transparent={0,0,0} This is any of the options like trails put them here NoradStsImage=sts.png This uses the image surplied with xplanet NoradStsText= If you want a label with the orbit put it here NoradStsDetail=transparent={0,0,0} This is any of the options like trails put them here NoradSatImage=sat.png This needs an image downloaded for it. NoradSatText= If you want a label with the orbit put it here NoradSatDetail=transparent={0,0,0} This is any of the options like trails put them here
The images that I use are above if you don't wish to download the zip file with all of them together
EclipseThis file puts an eclipse track on the globe during the 24 hours up to and including the eclipse time. If used with updatelabel you will be notified that the eclipse is happening and where. Please note this does require writing files to the local disk. This is because it will download the data for the next eclipse and save it the harddisk to avoid downloading data again and again. A New Version of Xplanet is due by the end of the year, and will support eclipses, so this script will be rewritten by the 2nd December to only draw a track, and if used with updatelabel to give 24 hours notice. I have now finished the rewrite, while I could then remove the storms, earthquakes, volcanos and norad data out of the whole, I can't remove the updatelabel and eclipses. This is because they became a little more interrelated than I first thought. For this reason, the old eclipse scripts are now not being developed and I recogmend you move to TotalMarker for the use of eclipses in the future. You will not be able to transfer the eclipse.ini settings to totalmarker. Sorry. If you are already using the perl version I will offer you the perl server version if you email me. Update LabelI have now finished the rewrite, while I could then remove the storms, earthquakes, volcanos and norad data out of the whole, I can't remove the updatelabel and eclipses. This is because they became a little more interrelated than I first thought. In addition I need a way to run the updatelabel directly after the other options, so it makes sense to make it interegrated. For this reason, the old updatelabel scripts are now not being developed and I recogmend you move to TotalMarker for the use of eclipses in the future. You will not be able to transfer the updatelabel.ini settings to totalmarker. Sorry. If you are already using the perl version I will offer you the perl server version if you email me.
 |


